Modern API platforms live and die by their tail latency. Your users do not care that the “average” response time is fine if 5% of requests are 10× slower. This post walks through using k6 to benchmark Azure API Management (APIM) backed APIs, first with a basic latency script and then with per‑request telemetry streamed into Azure Application Insights for deep correlation. We will also show how to run k6 inside Azure Container Apps as a repeatable, cloud‑side load generator.
What is k6 and Why Use It for Latency Work?
k6 is an open‑source, scriptable load testing tool (JavaScript) focused on developer ergonomics and high‑performance execution (written in Go). Key reasons it fits API latency benchmarking:
- Scriptable in JS: Easy to codify request patterns, correlation headers, custom logic.
- Native trend stats: p(90), p(95), p(99), p(99.9) without extra tooling.
- Deterministic load during a fixed VU or scenario window.
- Extensibility: Custom output (JSON, InfluxDB, Prometheus, App Insights via HTTP), custom tagging, summary formatting.
- Container‑friendly: One-line
docker runlocally, or run in Kubernetes / Azure Container Apps.
For latency investigations you typically care about:
- Median (p50) for “bulk baseline”.
- p95 / p99 for tail (user pain region).
- Max (outliers, potential incidents / retries / cold starts).
- Error rate (must stay low while pushing higher concurrency or arrival rate).
Dissecting the Basic Script
Core goals of the baseline script:
- Drive a POST request to your APIM endpoint.
- Attach a correlation identifier you can later search across APIM diagnostics and backend logs.
- Keep configuration entirely in environment variables for portability.
Minimal version (excerpt):
import http from 'k6/http';
import { check, sleep } from 'k6';
import { uuidv4 } from 'https://jslib.k6.io/k6-utils/1.4.0/index.js';

export const options = {
  vus: Number(__ENV.VUS || 5),
  duration: __ENV.DURATION || '30s',
  thresholds: {
    http_req_failed: ['rate<0.01'],
    http_req_duration: ['p(95)<1000', 'p(99)<3000']
  }
};
Generating correlation + W3C traceparent (simplified):
function makeTraceParent(guid) {
  const hex = guid.replace(/-/g, '');
  const traceId = (hex + '0'.repeat(32)).substring(0, 32);
  const spanId = hex.substring(0, 16);
  return `00-${traceId}-${spanId}-01`;
}
Executing one iteration (one request):
export default function () {
  const url = __ENV.TARGET_URL; // required
  const corr = uuidv4();
  const body = JSON.stringify({ transactionId: corr });
  const headers = {
    'Content-Type': 'application/json',
    'x-correlation-id': corr,
    'traceparent': makeTraceParent(corr)
  };
  const res = http.post(url, body, { headers });
  check(res, { 'status is 200/201/202': r => [200,201,202].includes(r.status) });
  const think = Number(__ENV.THINK_MS || 0);
  if (think > 0) sleep(think / 1000);
}
Key environment variables:
TARGET_URL(required)VUS(virtual users)DURATION(e.g.,1m,30s,5m)THINK_MS(optional pause per iteration)
Run it locally via Docker (WSL example – adjust mount path):
wsl docker run --rm \
  -e TARGET_URL="https://your-apim.azure-api.net/casper/transaction" \
  -e VUS=50 -e DURATION=1m \
  -v /mnt/c/Repo/RPS-Benchmark/scripts:/scripts \
  grafana/k6:latest run /scripts/k6-basic.js
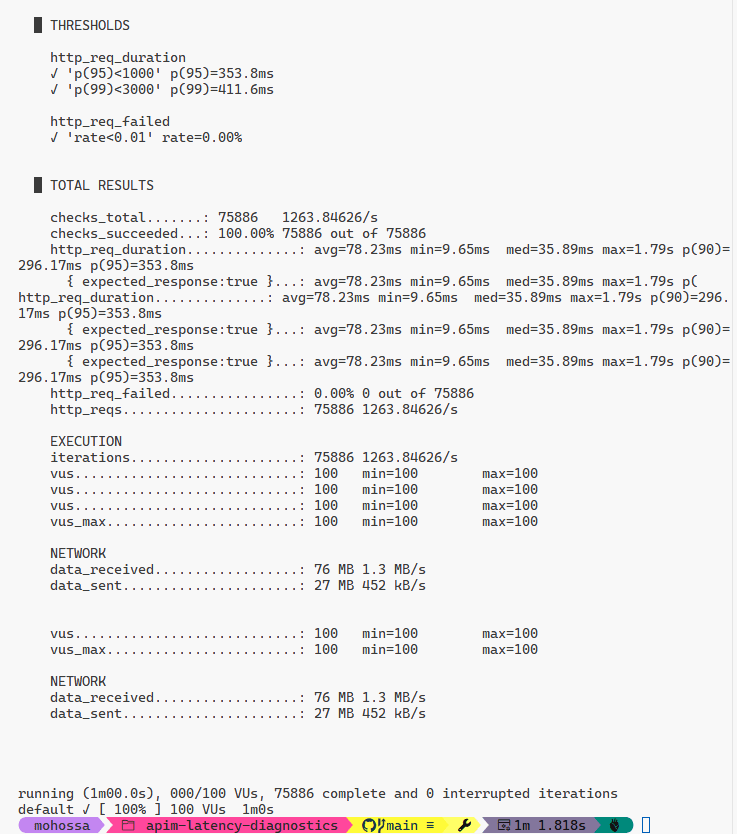
Interpreting core metrics:
http_req_duration– end‑to‑end latency.http_reqs– total requests.http_req_failed– failure rate.iteration_duration– includes JS overhead + request.
Percentiles (p90, p95, p99) highlight whether the tail is degrading under load. If p99 is far from median, pursue correlation of slow IDs.
Running k6 in Azure Container Apps (ACA) as a Job
Azure Container Apps lets you run ephemeral jobs (short-lived executions) or long-running revisions. For load tests, jobs are ideal: they spin up, execute, stop, and you capture their logs.
High-level steps:
- (Optional) Push a custom image if you need embedded scripts; otherwise mount or pass them at build time. For simplicity we use the public
grafana/k6image and a ConfigMap-like approach below (alternative: bake scripts into your own image). - Create a resource group and Container Apps environment.
- Create a Job that runs k6 with environment variables.
- Start the Job and watch logs.
Note: For production‑like network fidelity you can enable VNet integration / private endpoints on the Container Apps environment so your load traffic traverses similar network paths as real consumers. That is intentionally omitted here for brevity.
Create Resource Group & Environment
az group create -n rg-k6-bench -l eastus
az containerapp env create \
  -g rg-k6-bench \
  -n k6-env \
  -l eastus
(Optional) Build a Custom k6 Image with Scripts
Create a Dockerfile (if you want your scripts inside the image):
FROM grafana/k6:latest
WORKDIR /scripts
COPY k6-basic.js ./
COPY k6-azmon.js ./
Push to Azure Container Registry (ACR):
az acr create -n k6benchacr -g rg-k6-bench --sku Basic
az acr login -n k6benchacr
docker build -t k6benchacr.azurecr.io/k6-bench:latest .
docker push k6benchacr.azurecr.io/k6-bench:latest
If you skip this, you can reference grafana/k6:latest directly; you just need a way to provide your JS (volume mount is not directly supported in ACA jobs from local path, so custom image or remote fetch is easier).
Create an ACA Job for the Basic Test
az containerapp job create \
  -g rg-k6-bench \
  -n k6-basic-job \
  --environment k6-env \
  --image grafana/k6:latest \
  --command "run" \
  --args "/scripts/k6-basic.js" \
  --cpu 0.5 --memory 1Gi \
  --replica-timeout 1800 \
  --replica-completion-count 1 \
  --env-vars TARGET_URL="https://your-apim.azure-api.net/casper/transaction" VUS=50 DURATION=1m
Because the public image does not contain your script by default, if you used the custom image path instead:
az containerapp job create \
  -g rg-k6-bench \
  -n k6-basic-job \
  --environment k6-env \
  --image k6benchacr.azurecr.io/k6-bench:latest \
  --command "run" \
  --args "/scripts/k6-basic.js" \
  --cpu 0.5 --memory 1Gi \
  --replica-timeout 1800 \
  --replica-completion-count 1 \
  --env-vars TARGET_URL="https://your-apim.azure-api.net/casper/transaction" VUS=50 DURATION=1m
Run the job:
az containerapp job start -g rg-k6-bench -n k6-basic-job
Fetch logs:
az containerapp logs show -g rg-k6-bench -n k6-basic-job --type job
Scale considerations:
- Increase
--replica-completion-countreplicas for parallel generators (independent pods) if you want more aggregate RPS (ensure backend is sized accordingly). - For consistent arrival rate across replicas, consider scenario scripts using
constant-arrival-rate(not covered fully here but easy to add).
Network notes (not implemented here):
- Use
--internal-onlyon the environment + VNet injection for realistic latency. - Private endpoint or Private Link for APIM (Internal mode) isolates test traffic.
Shipping Per‑Request Latency to Application Insights
Sometimes a percentile is not enough—you need the exact correlation IDs of the slowest requests to debug in APIM diagnostics or backend traces. The k6-azmon.js script sends each (or a sampled subset) request as a trace to Application Insights via the ingestion API.
Environment Variables
| Variable | Purpose |
|---|---|
TARGET_URL | API endpoint under test |
APPINSIGHTS_IKEY | Application Insights instrumentation key (GUID) |
VUS, DURATION, THINK_MS | Load shaping knobs |
BATCH_SIZE | Number of telemetry items per ingestion POST |
FLUSH_INTERVAL_MS | Time-based flush when buffer not full |
SAMPLING | 1 = all requests; 0.1 = 10% sample |
MAX_BUFFER | Safety upper bound before forced flush |
PRETTY_SUMMARY | If set, prints concise latency/ingestion block |
Building Telemetry Objects
function makeTelemetry(item) {
  return {
    name: 'Microsoft.ApplicationInsights.Message',
    time: item.time,
    iKey: IKEY,
    tags: {
      'ai.cloud.role': 'k6-loadgen',
      'ai.operation.id': item.correlationId,
      'ai.operation.parentId': item.correlationId.substring(0,16),
      'ai.internal.sdkVersion': 'k6:custom'
    },
    data: {
      baseType: 'MessageData',
      baseData: {
        message: `k6 request ${item.correlationId}`,
        severityLevel: 1,
        properties: {
          testType: 'k6-azmon',
          correlationId: item.correlationId,
          url: item.url,
          status: String(item.status),
          durationMs: String(item.durationMs),
          vu: String(item.vu),
          iteration: String(item.iteration),
          startTime: item.startTime,
          requestBodyBytes: String(item.requestBodyBytes),
          sampling: String(SAMPLING)
        }
      }
    }
  };
}
Request Execution + Sampling
function doRequest(track) {
  const corr = uuidv4();
  const start = Date.now();
  const body = JSON.stringify({ transactionId: corr });
  const headers = {
    'Content-Type': 'application/json',
    'x-correlation-id': corr,
    'traceparent': makeTraceParent(corr)
  };
  const res = http.post(TARGET_URL, body, { headers });
  const dur = Date.now() - start;
  check(res, { 'status<400': r => r.status < 400 });
  if (track) buffer.push(makeTelemetry({
      correlationId: corr,
      durationMs: dur,
      status: res.status,
      url: TARGET_URL,
      vu: __VU,
      iteration: iterationCounter++,
      startTime: new Date(start).toISOString(),
      requestBodyBytes: body.length,
      time: isoNow()
  }));
  if (buffer.length >= MAX_BUFFER) flush(true);
}
Batching & Flushing
function flush(force=false) {
  if (buffer.length === 0) return;
  if (!force && buffer.length < BATCH_SIZE && (Date.now()-lastFlush) < FLUSH_INTERVAL_MS) return;
  const payload = JSON.stringify(buffer);
  const res = http.request('POST', ingestionUrl, payload, { headers: { 'Content-Type': 'application/x-json-stream' } });
  if (res.status >= 400) {
    failedItems += buffer.length;
    console.error(`AppInsights ingestion failed status=${res.status}`);
  } else {
    sentCount += buffer.length;
  }
  flushCalls += 1;
  buffer = [];
  lastFlush = Date.now();
}
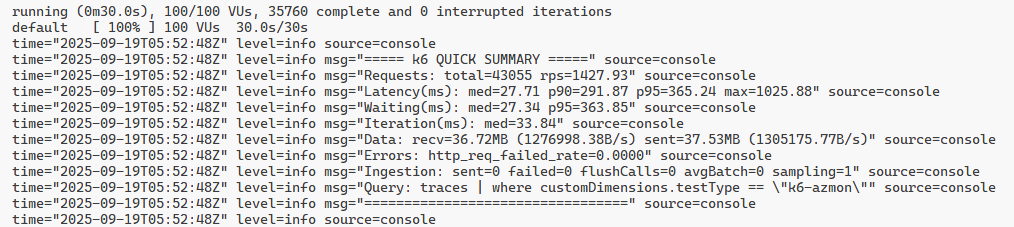
Pretty Summary Output
export function handleSummary(data) {
  flush(true);
  if (__ENV.PRETTY_SUMMARY) {
    const m = data.metrics || {};
    function gv(n,k){return m[n]?.values?.[k];}
    const concise = [
      '===== k6 QUICK SUMMARY =====',
      `Requests total=${gv('http_reqs','count')||0}`,
      `Latency(ms) med=${gv('http_req_duration','med')}`,
      'Query: traces | where customDimensions.testType == "k6-azmon"',
      '================================='
    ].join('\n');
    console.log('\n'+concise+'\n');
  }
  return {};
}
Running Locally
wsl docker run --rm \
  -e TARGET_URL="https://your-apim.azure-api.net/casper/transaction" \
  -e APPINSIGHTS_IKEY="<ikey-guid>" \
  -e VUS=50 -e DURATION=2m \
  -e BATCH_SIZE=5 -e FLUSH_INTERVAL_MS=2000 -e SAMPLING=1 -e PRETTY_SUMMARY=1 \
  -v /mnt/c/Repo/RPS-Benchmark/scripts:/scripts \
  grafana/k6:latest run /scripts/k6-azmon.js
Deploying the Telemetry Script as an ACA Job
Assuming you baked k6-azmon.js into a custom image (steps similar to earlier):
az containerapp job create \
  -g rg-k6-bench \
  -n k6-azmon-job \
  --environment k6-env \
  --image k6benchacr.azurecr.io/k6-bench:latest \
  --command "run" \
  --args "/scripts/k6-azmon.js" \
  --cpu 0.5 --memory 1Gi \
  --env-vars TARGET_URL="https://your-apim.azure-api.net/casper/transaction" APPINSIGHTS_IKEY="<ikey-guid>" VUS=40 DURATION=2m BATCH_SIZE=5 FLUSH_INTERVAL_MS=2000 SAMPLING=0.25 PRETTY_SUMMARY=1
Start & view logs:
az containerapp job start -g rg-k6-bench -n k6-azmon-job
az containerapp logs show -g rg-k6-bench -n k6-azmon-job --type job
Kusto Queries in Application Insights
Top 50 slowest (descending):
traces
| where customDimensions.testType == "k6-azmon"
| project timestamp, durationMs=tolong(customDimensions.durationMs), status=tostring(customDimensions.status), correlationId=customDimensions.correlationId, url=customDimensions.url
| order by durationMs desc
| take 50
Tail stats (>=300ms):
traces
| where customDimensions.testType == "k6-azmon"
| extend dur=tolong(customDimensions.durationMs)
| where dur >= 300
| summarize count(), p95=percentile(dur,95), p99=percentile(dur,99), max=max(dur)
Join with exceptions (if backend logs correlation id):
traces
| where customDimensions.testType == "k6-azmon"
| extend corr=customDimensions.correlationId, dur=tolong(customDimensions.durationMs)
| join kind=leftouter (
    exceptions | project corr=tostring(customDimensions['x-correlation-id']), exType=type, exMsg=message, exTs=timestamp
  ) on corr
| where dur >= 300
| project timestamp, corr, dur, status=customDimensions.status, exType, exMsg
| order by dur desc
Benchmarking & Latency Best Practices
| Concern | Guidance |
|---|---|
| Warm-up | Use an initial ramp (e.g., 30–60s) before measuring to avoid cold start bias. |
| Tail focus | Track p95/p99; log top N slow correlation IDs for root cause. |
| Arrival model | Consider constant-arrival-rate scenarios if you need consistent RPS independent of VUs. |
| Sampling | For very high volume, sample telemetry (SAMPLING=0.1) to control ingestion cost. |
| Isolation | Run from a controlled network (ACA with VNet) to reduce noise from local Wi-Fi / VPN. |
| Reproducibility | Version control scripts, pin image tags, and record env vars per run. |
| Correlation | Always propagate x-correlation-id (and a valid W3C traceparent if your backend traces). |
| Data hygiene | Do not include secrets in payload or headers; treat instrumentation key as semi-public but rotate if leaked. |
| Thresholds | Use k6 thresholds to fail fast in CI if latency regresses. |
| Outlier analysis | Export individual traces of the slowest requests; compare phases (DNS, connect, TLS, waiting) if needed. |
Closing Thoughts
Sustainable performance discipline is about continuous latency awareness, not ad-hoc stress tests. k6’s scripting model plus Azure Container Apps jobs deliver a portable, repeatable mechanism to:
- Recreate realistic load patterns quickly.
- Capture actionable percentile and error metrics.
- Emit per‑request telemetry for deep, correlation-driven diagnostics.
By pushing each (or sampled) request into Application Insights, you bridge summary statistics and forensic detail—no more guessing which single request out of thousands spiked your p99. Combine this with APIM diagnostic logs, backend distributed tracing, and you have an end‑to‑end latency observability loop.
Next experiments you might try:
- Add a
constant-arrival-ratescenario for strict RPS. - Introduce multiple endpoints / weights inside one script for mixed traffic.
- Push k6 output to Prometheus and build a live latency dashboard.
- Run comparative A/B tests between two backend versions (two TARGET_URLs) and diff percentile curves.
Happy benchmarking—and may your p99 stay close to your median.
